Executive summary
IT-Advisers will be formed as a consulting company specializing in the marketing of information technology and hi-tech products in international markets. Its founders are former marketers of consulting services, cloud-based software and market research, all in international markets.
IT Advisers (ITA) offers high-tech manufacturers and IT-companies a reliable, high-quality alternative to in-house resources for business development, market research, and channel development on an international scale.
Product Mix and Revenue
A true alternative to in-house resources offers a very high level of practical experience, know-how, contacts, and confidentiality. Clients must know that working with ITA is a more professional, less risky way to develop new areas even than working completely in-house with their own people.
Keys to Success
- Excellence in fulfilling the promise completely confidential, reliable, trustworthy expertise and information.
- Developing visibility to generate new business leads.
- Leveraging from a single pool of expertise into multiple revenue generation opportunities: retainer consulting, project consulting, market research, and market research published reports.
| | 2022 | 2023 | 2024 |
| Cash | 189,633 | 327,738 | 269,216 |
| Sales revenue | 1,800,000 | 2,200,000 | 2,600,000 |
| Net profit for financial year | 154,106 | 175,235 | 293,034 |
| Operating margin | 8.56% | 7.97% | 11.3% |
| Owners' equity | 214,106 | 389,341 | 662,374 |
| Return on equity (per year) | 72.0% | 45.0% | 44.2% |
Company overview
IT Advisers (ITA) is a new company providing high-level expertise in international high-tech business development, channel development, distribution strategies and marketing of high tech products. It will focus initially on providing two kinds of international triangles:
- Providing United States clients with development for European and Latin American markets.
- Providing the United Kingdom and European clients with development for the US and Latin American markets.
As it grows it will take on people and consulting work in related markets, such as the rest of Latin America and the Far East, also similar markets. As it grows it will look for additional leverage by taking brokerage positions and representation positions to create percentage holdings in product results.
ITA will be created as a California C corporation based in San Jose, owned by its principal investors and principal operators. As of this writing, it has not been chartered yet and is still considering alternatives to the legal formation. The initial office will be established in a quality office space in the "Silicon Valley" area of California, the heart of the U.S. high tech and software industry.
ITA offers expertise in channel distribution, channel development, software, and market development, sold and packaged in various ways that allow clients to choose their preferred relationship: these include small business consulting relationships, project-based consulting, relationship and alliance brokering, sales representation and market representation, project-based market research, published market research and information forum events.
| Pic 1. HTA Headquarters |
|
Products and services
ITA offers the expertise an IT-company needs to develop new product distribution and new market segments in new markets. This can be taken as high-level retainer consulting, market research reports, software applications and/or project-based consulting.
Retainer consulting - we represent a client company as an extension of its business development and market development functions. This begins with a complete understanding of the client company's situation, objectives, business plan, and constraints. We then represent the client company quietly and confidentially, sifting through new market developments and new opportunities as is appropriate to the client, representing the client in initial talks with possible allies, vendors, and channels.
Project consulting - Proposed and billed on a per-project and per- milestone basis, project consulting offers a client company a way to harness our specific qualities and use our expertise to solve specific problems, develop and write business plans, develop specific information, software.
Market research - group studies available to selected clients at $5,000 per unit. A group study is packaged and published, a complete study of a specific market, channel, or topic. Examples might be studies of developing consumer channels in Brazil or Mexico or implications of changing margins in software.
In the future, ITA will broaden the coverage by expanding into coverage of additional markets (e.g. all of Latin America, Far East, Western Europe) and additional product areas (e.g. telecommunications, web-based software, and technology integration). We are also studying the possibility of newsletter or electronic newsletter services, or perhaps special on- topic reports.
Pricing and sales
ITA (IT-Advisers) will be priced at the upper edge of what the market will bear, competing with the name brand consultants.
Consulting should be based on $5,000 per day for project consulting, $2,000 per day for market research, and $10,000 per month and up for retainer consulting. Market research reports should be priced at $5,000 per a report, which will, of course, require that reports be very well planned, focused on very important topics very well presented.
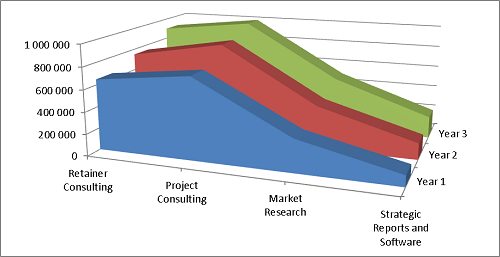
The annual sales projections, gross margins and cost of sales are included here in the following tables.
| Products and services | 2022 | 2023 | 2024 |
| Retainer Consulting | 650,000 | 750,000 | 900,000 |
| Project Consulting | 750,000 | 900,000 | 1,000,000 |
| Market Research | 300,000 | 400,000 | 500,000 |
| Strategic Reports and Software | 100,000 | 150,000 | 200,000 |
| | 1,800,000 | 2,200,000 | 2,600,000 |
| Products and services | 2022 | 2023 | 2024 |
| Retainer Consulting | 85 | 85 | 85 |
| Project Consulting | 85 | 85 | 85 |
| Market Research | 30 | 30 | 30 |
| Strategic Reports and Software | 60 | 60 | 60 |
| Products and services | 2022 | 2023 | 2024 |
| Retainer Consulting | 97,500 | 112,500 | 135,000 |
| Project Consulting | 112,500 | 135,000 | 150,000 |
| Market Research | 210,000 | 280,000 | 350,000 |
| Strategic Reports and Software | 40,000 | 60,000 | 80,000 |
| | 460,000 | 587,500 | 715,000 |
| Break-even analysis (USD) |
| | 2022 | 2023 | 2024 |
| Sales revenue | 1,800,000 | 2,200,000 | 2,600,000 |
| Cost of sales | 460,000 | 587,500 | 715,000 |
| Variable expenses, total | 460,000 | 587,500 | 715,000 |
| Labour cost | 805,920 | 953,580 | 996,360 |
| Other operating expenses | 352,500 | 455,000 | 550,000 |
| Depreciation of fixed assets | 5,000 | 5,000 | 11,000 |
| Financial expenses | 5,351 | 4,215 | 2,047 |
| Fixed expenses, total | 1,168,771 | 1,417,795 | 1,559,407 |
| Gross margin | 74.4% | 73.3% | 72.5% |
| Break-even sales revenue | 1,569,992 | 1,934,354 | 2,150,906 |
| Sales revenue above break-even | 230,008 | 265,646 | 449,094 |
Marketing strategy
ITA will be focusing on information technology manufacturers of computer hardware and software, services, networking, who want to sell into markets in the United States, United Kingdom, Europe, and Latin America. These are mostly larger companies, and occasionally medium-sized companies.
Our most important group of potential customers are executives in larger corporations. These are marketing managers, general managers, sales managers, sometimes charged with an international focus and sometimes charged with the market or even specific channel focus. They do not want to waste their time or risk their money looking for bargain information or questionable expertise. As they go into markets looking at new opportunities, they are very sensitive to jeopardize their company's name and reputation.
The consulting industry is pulverized and disorganized, thousands of smaller consulting organizations and individual consultants for every one of the few dozen well-known companies. Consulting is a disorganized industry, with participants ranging from major international name brand consultants to tens of thousands of individuals. One of ITA's challenges will be establishing itself as a "real" consulting company, positioned as a relatively risk-free corporate purchase.
At the highest level are the few well established major names in management consulting. Most of these are organized as partnerships established in major markets around the world, linked together by interconnecting directors and sharing the name and corporate wisdom. Some evolved from accounting companies and some from management consulting. These companies charge very high rates for consulting and maintain relatively high overhead structures and fulfillment structures based on partners selling and junior associates fulfilling. At the intermediate level are some function specific or market specific consultants, such as the market research firms or channel development firms.
Market segmentation
- Large manufacturer corporations - our most important market segment is the large manufacturer of high-technology products, such as Apple, Hewlett-Packard, IBM, Microsoft. These companies will be calling on ITA for development functions that are better spun off than managed in-house, and for market research, and for market forums.
- Medium sized growth companies: particularly in software, multimedia, and some related high growth fields, ITA will be able to offer an attractive development alternative to the company that is management constrained and unable to address opportunities in new markets and new market segments.
Competition
The competition comes in several forms:
- The most significant competition is no consulting at all, companies choosing to do business development, planning, and channel development and market research in-house. Their own managers do this on their own, as part of their regular business functions. Our key advantage in competition with in-house development is that managers are already overloaded with responsibilities, they don't have time for additional responsibilities in new market development or new channel development. Also, ITA can approach alliances, vendors, and channels on a confidential basis, gathering information and making initial contacts in ways that the corporate managers can't.
- The high-level prestige management consulting: McKinsey, Boston Consulting Group, etc. These are essentially generalists who take their name-brand management consulting into specialty areas. Their other very important weakness is the management structure that has the partners selling new jobs, and inexperienced associates delivering the work. We compete against them as experts in our specific fields, and with the guarantee that our clients will have the top-level people doing the actual work.
- The third general kind of competitor is the international market research company: Dataquest, Stanford Research Institute, etc. These companies are formidable competitors for published market research and market forums, but cannot provide the kind of high-level consulting that ITA will provide.
- The fourth kind of competition is the market-specific smaller house. For example Nomura Research in Japan.
- Sales representation, brokering and deal catalysts are an ad-hoc business form that will be defined in detail by the specific nature of each individual case.
Management and staffing
The initial management team depends on the founders themselves, with little back-up. As we grow we will take on additional consulting help, plus graphics/editorial, sales, and marketing. ITA should be mainly managed by working partners. In the beginning, we assume 3-5 partners. We will invite one international partner from Europe. The organization has to be very flat in the beginning, with each of the founders responsible for his or her own work and management.
The ITA business requires a very high level of international experience and expertise, which means that it will not be easily leveraged in the common consulting company mode in which partners run the business and make sales, while associates fulfill. Partners will necessarily be involved in the fulfillment of the core business proposition, providing the expertise to the clients.
The initial personnel plan is still tentative. It should involve 3-5 partners, 1-3 consultants, 1 strong marketing person, an office manager. Later we add more partners, consultants, and sales staff.
The annual personal estimates are included in the tables presented below.
| Personnel | 2022 | 2023 | 2024 |
| Partners | 5 | 5 | 5 |
| Consultants | 4 | 4 | 4 |
| Marketing manager | 0 | 1 | 1 |
| Sales reps | 2 | 2 | 2 |
| Office manager | 1 | 1 | 1 |
| | 12 | 13 | 13 |
| Average monthly salary (USD) |
| Personnel | 2022 | 2023 | 2024 |
| Partners | 5,000 | 6,000 | 6,500 |
| Consultants | 5,300 | 5,400 | 5,500 |
| Marketing manager | 4,500 | 4,700 | 4,700 |
| Sales reps | 4,600 | 4,800 | 4,900 |
| Office manager | 3,000 | 3,200 | 3,200 |
| | 2022 | 2023 | 2024 |
| Wages and salaries | 700,800 | 829,200 | 866,400 |
| Social security costs | 105,120 | 124,380 | 129,960 |
| Labour cost | 805,920 | 953,580 | 996,360 |
| REVENUES | 1,800,000 | 2,200,000 | 2,600,000 |
| Labour cost to revenues | 44.8% | 43.3% | 38.3% |
Implementation
Total start-up expense (including legal costs, branding, stationery, other one time expenses) come to $30,000. The annual overhead expense estimates are presented in the table below.
Start-up assets required include $50,000 in fixed assets like office furniture, computers, software, and other equipment and tools.
| Other operating expenses (USD) |
| Other operating expenses | 2022 | 2023 | 2024 |
| Startup expenses | 30,000 | 0 | 0 |
| Marketing | 60,000 | 70,000 | 80,000 |
| Travel | 150,000 | 250,000 | 300,000 |
| Office expenses and software costs | 100,000 | 120,000 | 150,000 |
| Insurance | 5,000 | 5,000 | 5,000 |
| Other fixed expenses | 7,500 | 10,000 | 15,000 |
| | 352,500 | 455,000 | 550,000 |
| Assets purchase value (USD) |
| Fixed assets | 2022 | 2023 | 2024 |
| Startup fixed assets (equipment) | 50,000 | 0 | 0 |
| New office | 0 | 0 | 300,000 |
| | 50,000 | 0 | 300,000 |
Financials
The paid-in capital from partners and other investors will be $135,000.
An annuity loan will be taken from a bank in the amount of $500,000 for 60 months.
The performance measures, business plan financial projections and break-even analysis are presented below.
| Performance measures (USD) |
| | 2022 | 2023 | 2024 |
| Sales revenue | 1,800,000 | 2,200,000 | 2,600,000 |
| Cost of sales | 460,000 | 587,500 | 715,000 |
| Gross profit | 1,340,000 | 1,612,500 | 1,885,000 |
| Other operating expenses | 352,500 | 455,000 | 550,000 |
| Labour cost | 805,920 | 953,580 | 996,360 |
| Depreciation of fixed assets | 5,000 | 5,000 | 11,000 |
| Operating profit | 176,580 | 198,920 | 327,640 |
| EBITDA | 181,580 | 203,920 | 338,640 |
| Financial income and expenses | -5,351 | -4,215 | -2,047 |
| Profit before income tax | 171,229 | 194,705 | 325,593 |
| Income tax expense | 17,123 | 19,471 | 32,559 |
| Profit | 154,106 | 175,235 | 293,034 |
| | | | |
| Operating margin | 8.56% | 7.97% | 11.3% |
| Gross margin | 74.4% | 73.3% | 72.5% |
| Sales per employee | 150,000 | 169,231 | 200,000 |
| Value added | 987,500 | 1,157,500 | 1,335,000 |
| Value added per employee | 82,292 | 89,038 | 102,692 |
| | | | |
| Return on equity (per year) | 72.0% | 45.0% | 44.2% |
| Quick ratio | 5.30 | 7.53 | 10.5 |
| Current ratio | 5.30 | 7.53 | 10.5 |
| ISCR | 33.9 | 48.4 | 165 |
| DSCR | 20.2 | 5.83 | 10.2 |
| Debt to equity ratio | 0.36 | 0.12 | 0.02 |
| Debt to capital ratio | 26.3% | 10.5% | 2.13% |
| | | | |
| Receivables collection period, days | 15.0 | 15.0 | 15.0 |
| Payable period, days | 15.0 | 15.0 | 15.0 |
| | 2022 | 2023 | 2024 |
| Sales revenue | 1,800,000 | 2,200,000 | 2,600,000 |
| Cost of sales | 460,000 | 587,500 | 715,000 |
| Other operating expenses | 352,500 | 455,000 | 550,000 |
| Labour cost | | | |
| Wages and salaries | 700,800 | 829,200 | 866,400 |
| Social security costs | 105,120 | 124,380 | 129,960 |
| Total labour cost | 805,920 | 953,580 | 996,360 |
| Depreciation of fixed assets | 5,000 | 5,000 | 11,000 |
| Operating profit | 176,580 | 198,920 | 327,640 |
| Financial expenses | | | |
| Interest expense | 5,351 | 4,215 | 2,047 |
| Total financial expenses | 5,351 | 4,215 | 2,047 |
| Profit before income tax | 171,229 | 194,705 | 325,593 |
| Income tax expense | 17,123 | 19,471 | 32,559 |
| Net profit for financial year | 154,106 | 175,235 | 293,034 |
| | 2022 | 2023 | 2024 |
| ASSETS | | | |
| Current assets | | | |
| Cash | 189,633 | 327,738 | 269,216 |
| Receivables and prepayments | | | |
| Trade receivables | 75,006 | 91,669 | 108,343 |
| Inventories | | | |
| Inventories | 0 | 0 | 0 |
| Total current assets | 264,639 | 419,406 | 377,558 |
| Fixed assets | | | |
| Tangible assets | | | |
| Machinery and equipment | 50,000 | 50,000 | 350,000 |
| Less: Accumulated depreciation | -5,000 | -10,000 | -21,000 |
| Total | 45,000 | 40,000 | 329,000 |
| Total fixed assets | 45,000 | 40,000 | 329,000 |
| Total assets | 309,639 | 459,406 | 706,558 |
| LIABILITIES and OWNERS' EQUITY | | | |
| Liabilities | | | |
| Current liabilities | | | |
| Loan liabilities | | | |
| Short-term loans and notes | 0 | 0 | 0 |
| Current portion of long-term loan liabilities | 30,780 | 31,197 | 6,197 |
| Total | 30,780 | 31,197 | 6,197 |
| Debts and prepayments | | | |
| Trade creditors, goods | 19,168 | 24,480 | 29,796 |
| Trade creditors, other | 0 | 0 | 0 |
| Employee-related liabilities | 0 | 0 | 0 |
| Total | 19,168 | 24,480 | 29,796 |
| Total current liabilities | 49,948 | 55,678 | 35,993 |
| Long-term liabilities | | | |
| Long-term loan liabilities | | | |
| Loans, notes and financial lease payables | 45,585 | 14,388 | 8,190 |
| Total long-term liabilities | 45,585 | 14,388 | 8,190 |
| Total liabilities | 95,533 | 70,066 | 44,184 |
| Owners' equity | | | |
| Share capital in nominal value | 60,000 | 60,000 | 60,000 |
| Share premium | 0 | 0 | 0 |
| Retained profit/loss | 0 | 154,106 | 309,341 |
| Current year profit | 154,106 | 175,235 | 293,034 |
| Total owners' equity | 214,106 | 389,341 | 662,374 |
| Total liabilities and owners' equity | 309,639 | 459,406 | 706,558 |
| Cash flow statement (1-6 month) (USD) |
| | Jan-2022 | Feb-2022 | Mar-2022 | Apr-2022 | May-2022 | Jun-2022 |
| CASH FLOWS FROM OPERATING ACTIVITIES | | | | | | |
| Inflows | | | | | | |
| Payments from customers | 75,000 | 149,999 | 149,999 | 149,999 | 149,999 | 149,999 |
| Total | 75,000 | 149,999 | 149,999 | 149,999 | 149,999 | 149,999 |
| Outflows | | | | | | |
| Payments to vendors (goods) | 19,167 | 38,333 | 38,333 | 38,333 | 38,333 | 38,333 |
| Payment of salaries and wages | 58,400 | 58,400 | 58,400 | 58,400 | 58,400 | 58,400 |
| Social security costs | 8,760 | 8,760 | 8,760 | 8,760 | 8,760 | 8,760 |
| Payments to vendors (operating expenses) | 31,874 | 31,874 | 31,874 | 31,874 | 31,874 | 31,874 |
| Total | 118,201 | 137,367 | 137,367 | 137,367 | 137,367 | 137,367 |
| Net cash flow from operating activities | -43,201 | 12,632 | 12,632 | 12,632 | 12,632 | 12,632 |
| | | | | | | |
| CASH FLOWS FROM INVESTING ACTIVITIES | | | | | | |
| Inflows | | | | | | |
| Outflows | | | | | | |
| Payments to vendors (assets) | 50,000 | 0 | 0 | 0 | 0 | 0 |
| Total | 50,000 | 0 | 0 | 0 | 0 | 0 |
| Net cash flow from investing activities | -50,000 | 0 | 0 | 0 | 0 | 0 |
| | | | | | | |
| CASH FLOWS FROM FINANCING ACTIVITIES | | | | | | |
| Inflows | | | | | | |
| Payments from shareholders | 60,000 | 0 | 0 | 0 | 0 | 0 |
| Loan amounts received | 80,000 | 0 | 0 | 0 | 0 | 0 |
| Total | 140,000 | 0 | 0 | 0 | 0 | 0 |
| Outflows | | | | | | |
| Principal repayments | 0 | 0 | 0 | 0 | 445 | 448 |
| Interest expense | 292 | 467 | 467 | 467 | 467 | 464 |
| Dividends (net to shareholders) | 0 | 0 | 0 | 0 | 0 | 0 |
| Payment of corporate income tax | 1,427 | 1,427 | 1,427 | 1,427 | 1,427 | 1,427 |
| Corporate income tax on dividends | 0 | 0 | 0 | 0 | 0 | 0 |
| Total | 1,719 | 1,894 | 1,894 | 1,894 | 2,339 | 2,339 |
| Net cash flow from financing activities | 138,281 | -1,894 | -1,894 | -1,894 | -2,339 | -2,339 |
| | | | | | | |
| Net change in cash | 45,080 | 10,738 | 10,738 | 10,738 | 10,293 | 10,293 |
| Cash at the beginning | 0 | 45,080 | 55,819 | 66,557 | 77,295 | 87,589 |
| Cash at the end | 45,080 | 55,819 | 66,557 | 77,295 | 87,589 | 97,882 |
| Cash flow statement (3-6 quarter) (USD) |
| | Q3-2022 | Q4-2022 | Q1-2023 | Q2-2023 |
| CASH FLOWS FROM OPERATING ACTIVITIES | | | | |
| Inflows | | | | |
| Payments from customers | 449,997 | 450,003 | 533,338 | 549,999 |
| Total | 449,997 | 450,003 | 533,338 | 549,999 |
| Outflows | | | | |
| Payments to vendors (goods) | 114,999 | 115,001 | 141,563 | 146,874 |
| Payment of salaries and wages | 175,200 | 175,200 | 207,300 | 207,300 |
| Social security costs | 26,280 | 26,280 | 31,095 | 31,095 |
| Payments to vendors (operating expenses) | 80,622 | 80,634 | 113,745 | 113,745 |
| Total | 397,101 | 397,115 | 493,703 | 499,014 |
| Net cash flow from operating activities | 52,896 | 52,888 | 39,635 | 50,985 |
| | | | | |
| CASH FLOWS FROM INVESTING ACTIVITIES | | | | |
| Inflows | | | | |
| Outflows | | | | |
| Payments to vendors (assets) | 0 | 0 | 0 | 0 |
| Total | 0 | 0 | 0 | 0 |
| Net cash flow from investing activities | 0 | 0 | 0 | 0 |
| | | | | |
| CASH FLOWS FROM FINANCING ACTIVITIES | | | | |
| Inflows | | | | |
| Payments from shareholders | 0 | 0 | 0 | 0 |
| Loan amounts received | 0 | 0 | 0 | 0 |
| Total | 0 | 0 | 0 | 0 |
| Outflows | | | | |
| Principal repayments | 1,359 | 1,383 | 7,656 | 7,681 |
| Interest expense | 1,376 | 1,353 | 1,255 | 1,121 |
| Dividends (net to shareholders) | 0 | 0 | 0 | 0 |
| Payment of corporate income tax | 4,281 | 4,281 | 4,868 | 4,868 |
| Corporate income tax on dividends | 0 | 0 | 0 | 0 |
| Total | 7,016 | 7,016 | 13,779 | 13,670 |
| Net cash flow from financing activities | -7,016 | -7,016 | -13,779 | -13,670 |
| | | | | |
| Net change in cash | 45,879 | 45,872 | 25,856 | 37,315 |
| Cash at the beginning | 97,882 | 143,761 | 189,633 | 215,489 |
| Cash at the end | 143,761 | 189,633 | 215,489 | 252,804 |
| Cash flow statement (1-4 year) (USD) |
| | 2022 | 2023 | 2024 |
| CASH FLOWS FROM OPERATING ACTIVITIES | | | |
| Inflows | | | |
| Payments from customers | 1,724,995 | 2,183,337 | 2,583,326 |
| Total | 1,724,995 | 2,183,337 | 2,583,326 |
| Outflows | | | |
| Payments to vendors (goods) | 440,832 | 582,188 | 709,684 |
| Payment of salaries and wages | 700,800 | 829,200 | 866,400 |
| Social security costs | 105,120 | 124,380 | 129,960 |
| Payments to vendors (operating expenses) | 352,500 | 455,000 | 550,000 |
| Total | 1,599,252 | 1,990,768 | 2,256,044 |
| Net cash flow from operating activities | 125,742 | 192,570 | 327,282 |
| | | | |
| CASH FLOWS FROM INVESTING ACTIVITIES | | | |
| Inflows | | | |
| Outflows | | | |
| Payments to vendors (assets) | 50,000 | 0 | 300,000 |
| Total | 50,000 | 0 | 300,000 |
| Net cash flow from investing activities | -50,000 | 0 | -300,000 |
| | | | |
| CASH FLOWS FROM FINANCING ACTIVITIES | | | |
| Inflows | | | |
| Payments from shareholders | 60,000 | 0 | 0 |
| Loan amounts received | 80,000 | 0 | 0 |
| Total | 140,000 | 0 | 0 |
| Outflows | | | |
| Principal repayments | 3,635 | 30,780 | 31,197 |
| Interest expense | 5,351 | 4,215 | 2,047 |
| Dividends (net to shareholders) | 0 | 0 | 20,000 |
| Payment of corporate income tax | 17,123 | 19,471 | 32,559 |
| Corporate income tax on dividends | 0 | 0 | 0 |
| Total | 26,109 | 54,465 | 85,804 |
| Net cash flow from financing activities | 113,891 | -54,465 | -85,804 |
| | | | |
| Net change in cash | 189,633 | 138,105 | -58,522 |
| Cash at the beginning | 0 | 189,633 | 327,738 |
| Cash at the end | 189,633 | 327,738 | 269,216 |
| | 2022 | 2023 | 2024 |
| Current assets | 264,639 | 419,406 | 377,558 |
| Fixed assets | 45,000 | 40,000 | 329,000 |
| Current liabilities | 49,948 | 55,678 | 35,993 |
| Long-term liabilities | 45,585 | 14,388 | 8,190 |
| Owners' equity | 214,106 | 389,341 | 662,374 |
| Funding needs analysis (USD) |
| | 2022 | 2023 | 2024 |
| CASH FLOWS FROM OPERATING ACTIVITIES | | | |
| Inflows | | | |
| Payments from customers | 1,724,995 | 2,183,337 | 2,583,326 |
| Total | 1,724,995 | 2,183,337 | 2,583,326 |
| Outflows | | | |
| Payments to vendors (goods) | 440,832 | 582,188 | 709,684 |
| Payment of salaries and wages | 700,800 | 829,200 | 866,400 |
| Social security costs | 105,120 | 124,380 | 129,960 |
| Payments to vendors (operating expenses) | 352,500 | 455,000 | 550,000 |
| Total | 1,599,252 | 1,990,768 | 2,256,044 |
| Net cash flow from operating activities | 125,742 | 192,570 | 327,282 |
| | | | |
| CASH FLOWS FROM INVESTING ACTIVITIES | | | |
| Inflows | | | |
| Outflows | | | |
| Payments to vendors (assets) | 50,000 | 0 | 300,000 |
| Total | 50,000 | 0 | 300,000 |
| Net cash flow from investing activities | -50,000 | 0 | -300,000 |
| | | | |
| Net change in cash | 75,742 | 192,570 | 27,282 |
| Cash at the beginning | 0 | 75,742 | 268,312 |
| Cash at the end | 75,742 | 268,312 | 295,593 |
| Amount of funding needed (max) | 0 | | |
| | 2022 | 2023 | 2024 |
| Net profit | 154,106 | 175,235 | 293,034 |
| Working capital (adjusted) | 64,838 | 78,188 | 91,547 |
| Change in working capital | 64,838 | 13,351 | 13,358 |
| Assets purchase value | 50,000 | 0 | 300,000 |
| Depreciation of fixed assets | 5,000 | 5,000 | 11,000 |
| Loan amounts received | 80,000 | 0 | 0 |
| Principal repayments | 3,635 | 30,780 | 31,197 |
| Free cash flow to equity (FCFE) | 120,633 | 136,105 | -40,522 |
| Present value of FCFE | 100,528 | 94,517 | -23,450 |
| Total present value of FCFE | 171,594 | | |
| Terminal value | 0 | 0 | 1,465,169 |
| Present value of terminal value | 847,899 | | |
| Business value | 1,019,493 | 0 | 0 |